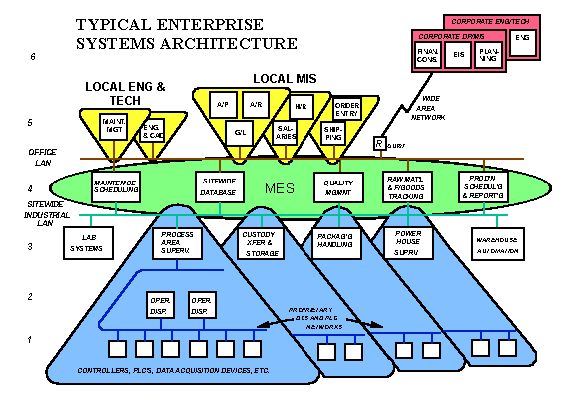
The PERA model indicates that Control and Information System products (both hardware and software) may be related to the physical plant (via the Enterprise Architecture Diagram), or to the Human and Organizational part of the enterprise (via the Organization Chart). Either way may be used to locate hardware and software products, however, in some cases one works better than the other. For example, in enterprise phases and/or industries which have a relatively few staff and highly specialized physical plant environments, the Enterprise Architecture is a good way to locate products. In other enterprises or phases, such as detail engineering, there may be a large number of people working within a single very consistent physical environment. In this case the Organizational chart provides a better way to identify products.
There is also a tendancy for hardware products to be more easily associated with the physical plant (Enterprise Architecture Diagram) and for software products to be more easily assoicated with the Human and Organizational aspects (Organization Chart). It is also possible to associate software and hardware, with Value Chain Diagrams and Work Flow Diagrams, or with vendors, or with general industry divisions (like continuous process industries and discrete manufacturing industries). We believe however that these organizations are less "fundamental" and less likely to stand the test of time.
Select whether you want to search for products using:
Click on the appropriate area on the Physical Architecture Diagram where the hardware product will be applied.

Products are divided by "Level" in the System Architecture (see Level Design Article ). Note that relative ratings of products (Market Share, Cost, Technology, and Service) for a certain product may be different when viewed in terms of a specific industry.
| Enterprise Management | 010 | Long Range Planning |
| R:2 C:1 | R:2 C:2 | R:2 C:3 |
| R:3 C:1 | R:3 C:2 | R:3 C:3 |
| R:4 C:1 | R:4 C:2 | R:4 C:3 |
| R:5 C:1 | R:5 C:2 | R:5 C:3 |
| R:6 C:1 | R:6 C:2 | R:6 C:3 |
| R:7 C:1 | R:7 C:2 | R:7 C:3 |
| R:8 C:1 | R:8 C:2 | R:8 C:3 |
| R:9 C:1 | R:9 C:2 | R:9 C:3 |
| R:10 C:1 | R:10 C:2 | R:10 C:3 |
| R:11 C:1 | R:11 C:2 | R:11 C:3 |
| R:12 C:1 | R:12 C:2 | R:12 C:3 |
| R:13 C:1 | R:13 C:2 | R:13 C:3 |
| R:14 C:1 | R:14 C:2 | R:14 C:3 |
| R:15 C:1 | R:15 C:2 | R:15 C:3 |
| R:16 C:1 | R:16 C:2 | R:16 C:3 |
| R:17 C:1 | R:17 C:2 | R:17 C:3 |
| R:18 C:1 | R:18 C:2 | R:18 C:3 |
| R:19 C:1 | R:19 C:2 | R:19 C:3 |
| R:20 C:1 | R:20 C:2 | R:20 C:3 |
| R:21 C:1 | R:21 C:2 | R:21 C:3 |
| R:22 C:1 | R:22 C:2 | R:22 C:3 |
| R:23 C:1 | R:23 C:2 | R:23 C:3 |
| R:24 C:1 | R:24 C:2 | R:24 C:3 |
| R:25 C:1 | R:25 C:2 | R:25 C:3 |
| R:26 C:1 | R:26 C:2 | R:26 C:3 |
| R:27 C:1 | R:27 C:2 | R:27 C:3 |
| R:28 C:1 | R:28 C:2 | R:28 C:3 |
| R:29 C:1 | R:29 C:2 | R:29 C:3 |
| R:30 C:1 | R:30 C:2 | R:30 C:3 |
Select the area from the Organization Chart where the software product will be applied.